The database window is the main window in OnePacs Workstation for macOS. The main purpose of this window is to allow you to access and manage the available datasets. When additional studies are imported, they appear in this window.
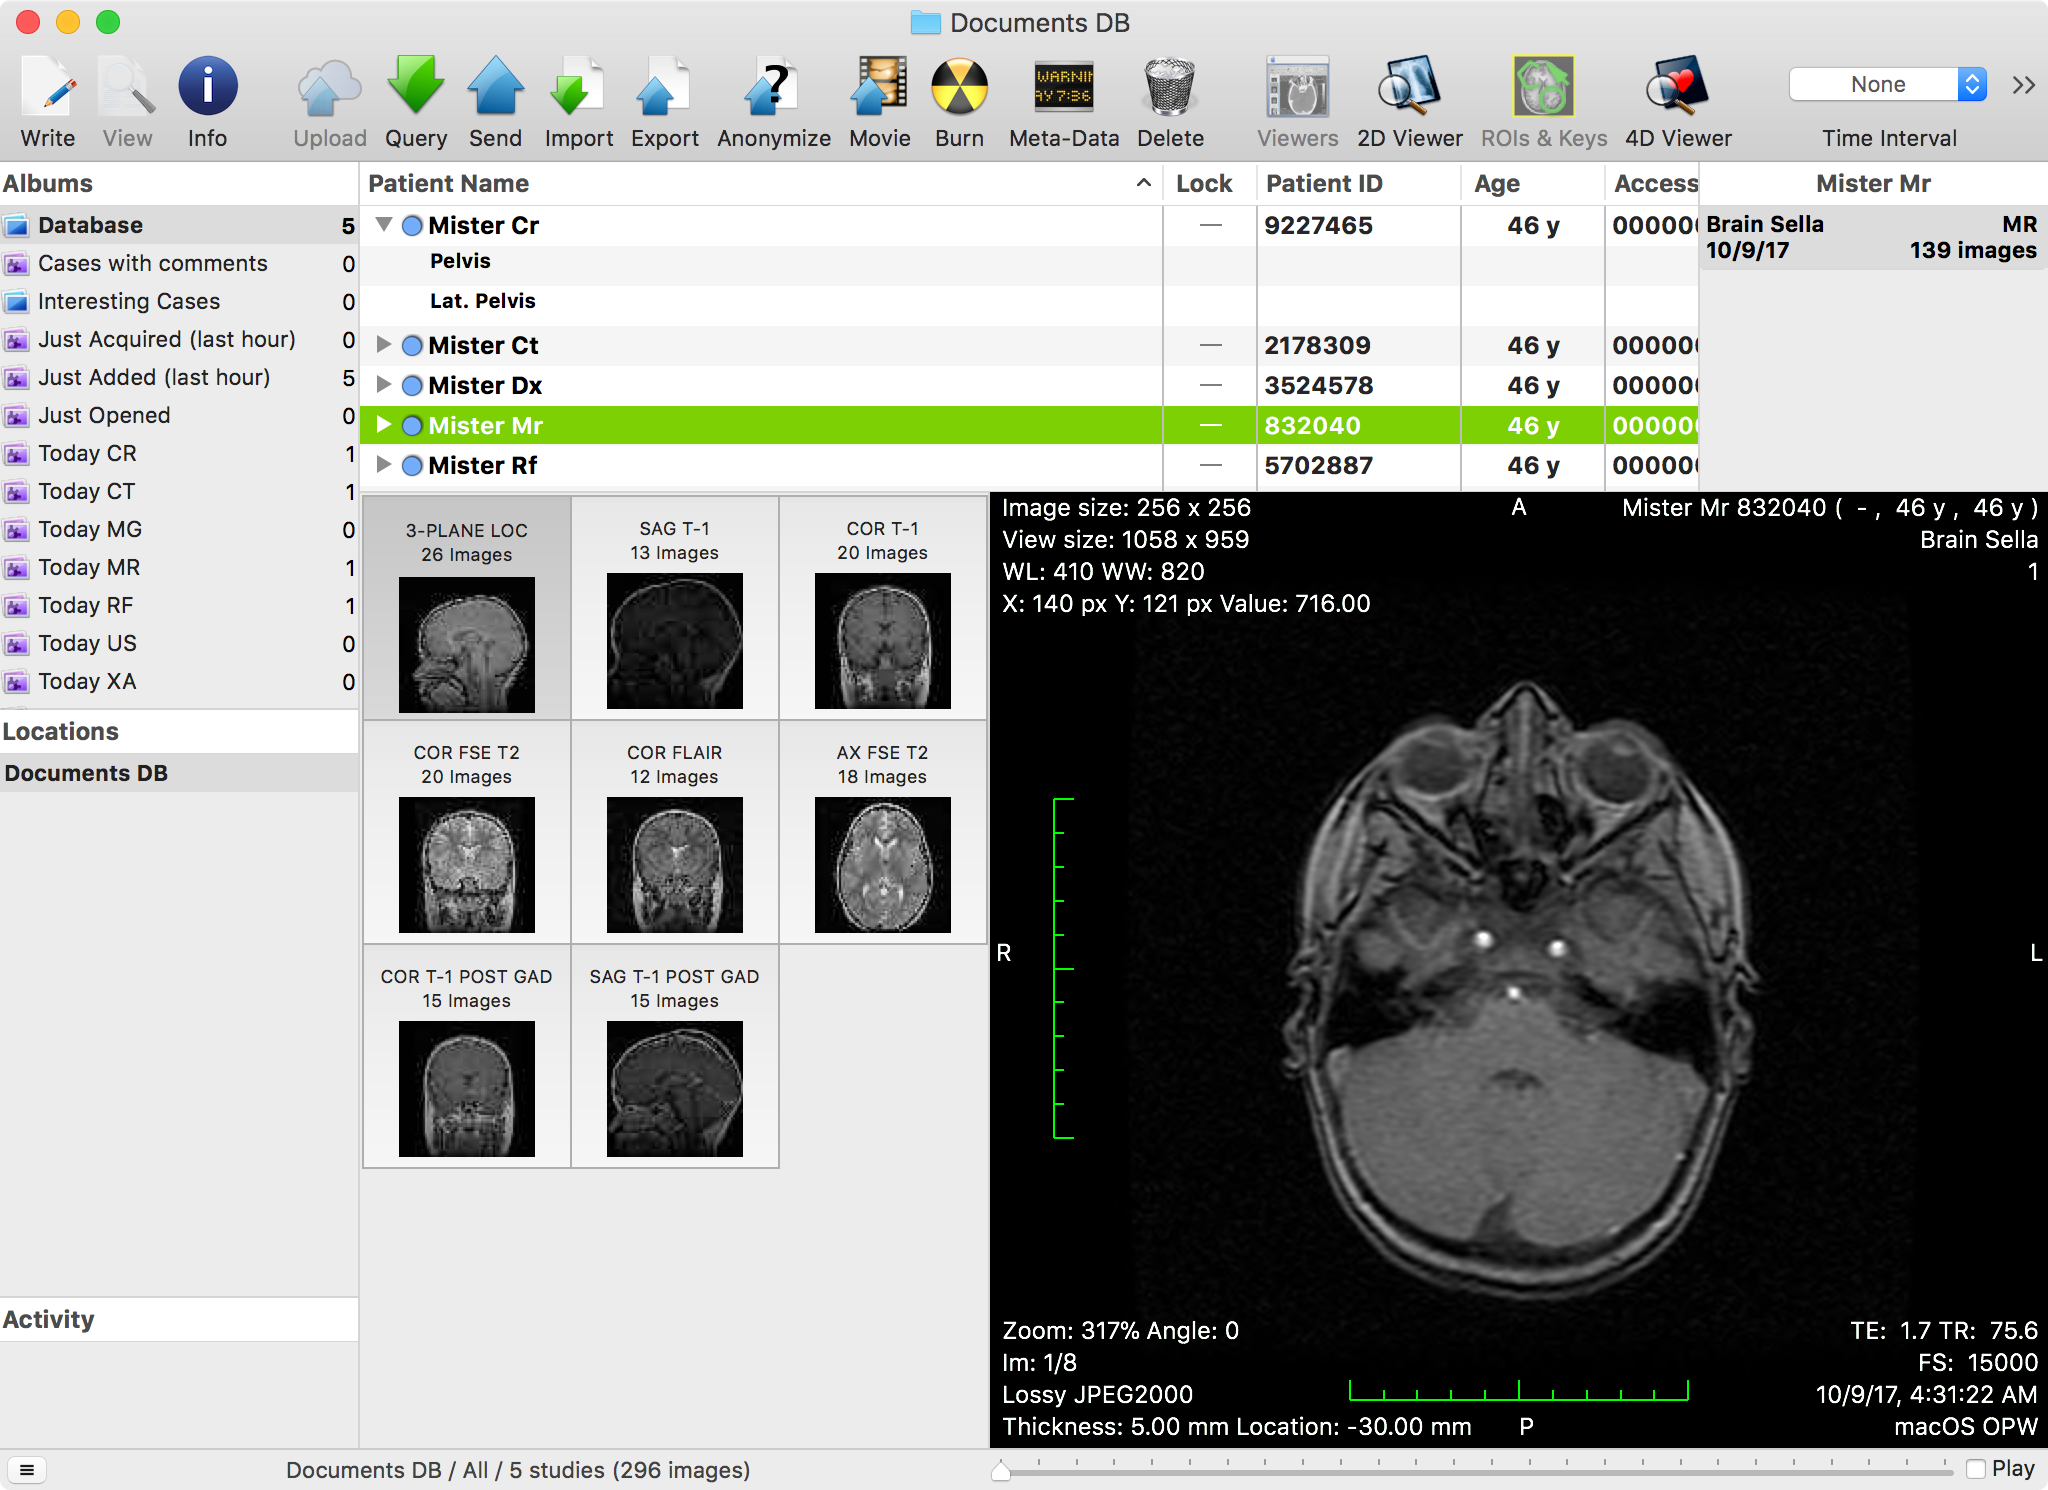
The main portion of the window is dedicated to the datasets browser. In the studies table, data is organized in disclosable study items. To the right of the outline, the history list displays a list of studies that belong to the same patient as the selected items. The selected studies or series are displayed in more detail in the lower portion of the window, where a grid of thumbnails is displayed on the left side. The selected element in this grid is previewed in the lower right portion of the window. The size of these views can be adjusted by dragging the borders in between them.
As the application main window, the database window also provides quick access to other databases and DICOM nodes, and displays the status of background processes. These extra elements are available in the left portion of the window, along with the albums list.
At the top of the window, the toolbar allows you to access tools that interact with the displayed data.
The Toolbar 
The database window toolbar provides access to tools and functions that interact with the selected database item, with the database itself or with global elements of the application interface.
Depending on the use you make of OnePacs Workstation for macOS, some tools may be more useful to you than others. Consequently, you can customize the toolbar to choose with toolbar items are displayed and in what order. To customize the toolbar, right-click on the window titlebar background and select the Customize Toolbar... menu item.
This customization interface is a common user interface element in macOS and you should be familiar with it. It allows you to reorder and insert items by dragging them to the desired position or out of the toolbar to remove them.
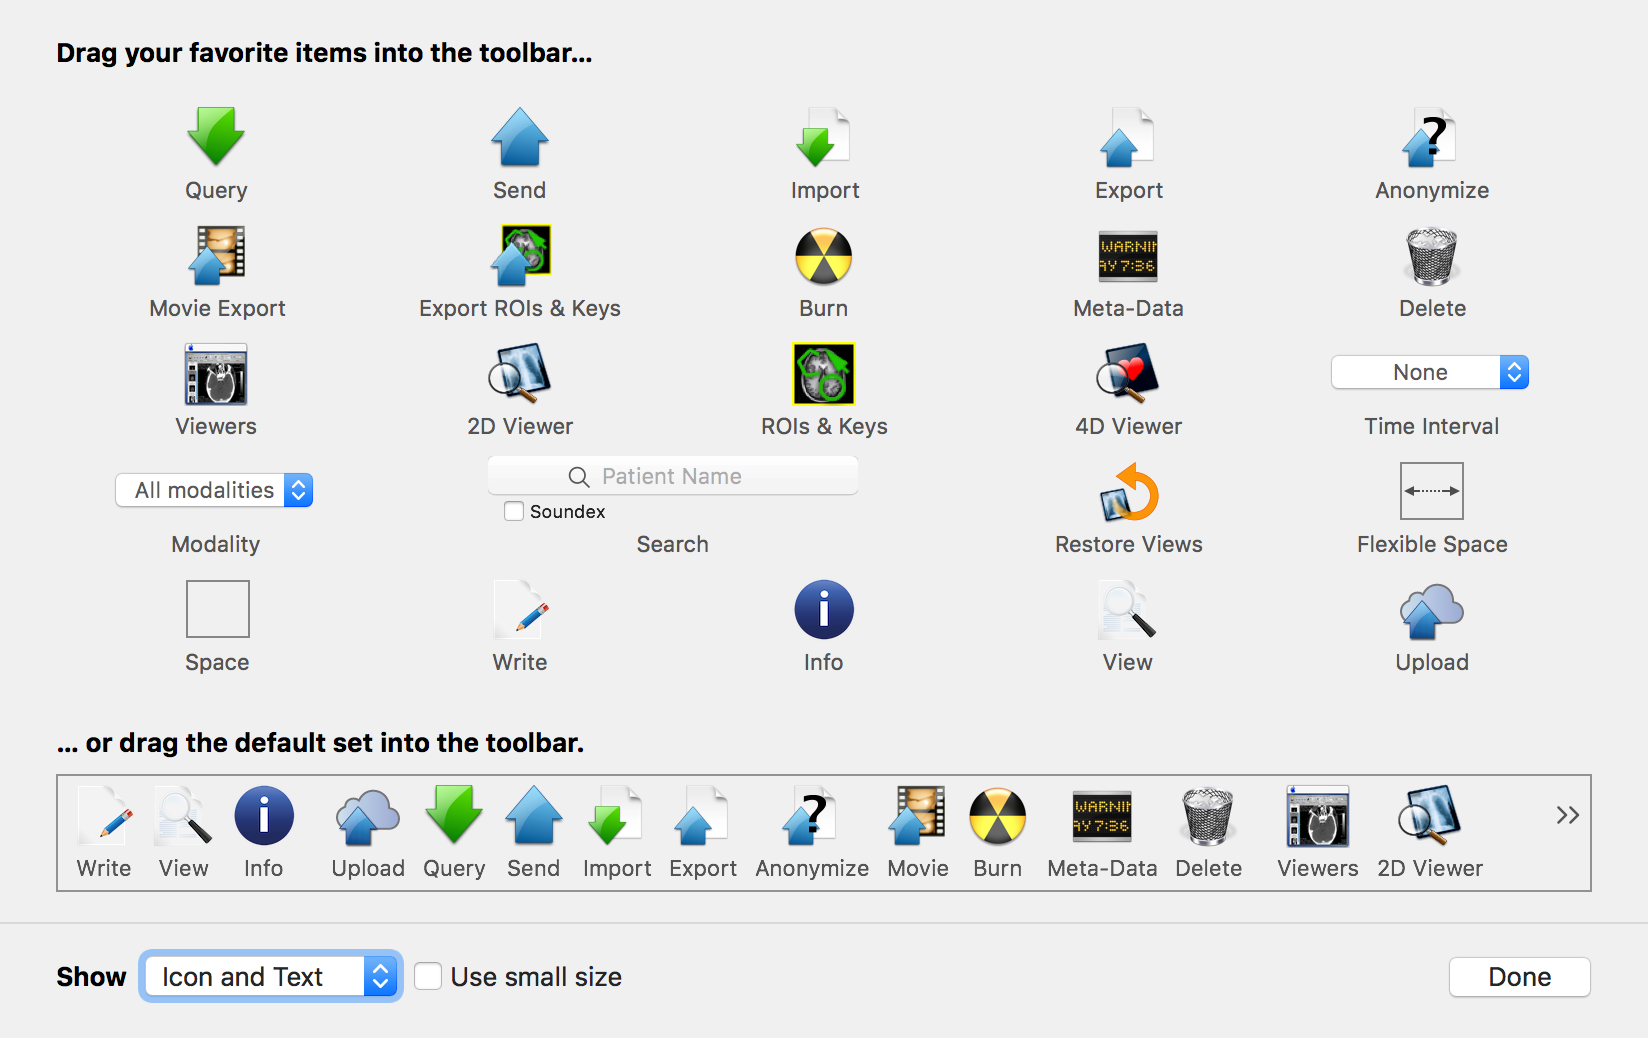
In this section, we will review these toolbar items while grouping them by their purpose.
Database Filtering
Additionally to the filtering applied because of the album selection, you may use the following tools to filter the studies table items.
 | |
 | |
 |
Data Visualization
|
 This button parses the temporal data of the selected series and opens a viewer that allows both spatial and temporal browsing of the series. This button parses the temporal data of the selected series and opens a viewer that allows both spatial and temporal browsing of the series. |
 This button opens a meta-data browser for the selected image. This button opens a meta-data browser for the selected image. |
 | This button has the same effect as double-clicking an item in the studies table or the thumbnails grid, or double-clicking the preview: it opens a viewer displaying the selected series (the one that is displayed in the preview). |
| This button parses the temporal data of the selected series and opens a viewer that allows both spatial and temporal browsing of the series. |
| This button opens a meta-data browser for the selected image. |
Data Import, Export and Anonymization
| This button opens the DICOM Query & Retrieve interface, allowing you to search the configured DICOM nodes for additional datasets. | |
| This button opens the DICOM Send interface, allowing you to send the selected datasets to a configured DICOM node. |
 | |
 |
Other

![]()


![]()
Spacers and Separators
 |
The Studies Table 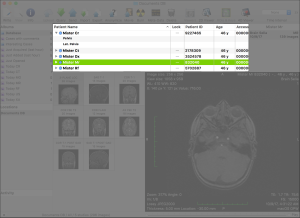
The studies table presents a list of all studies in the database. Every study item can be disclosed to display the study series.
The History List 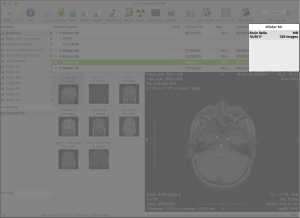
The Thumbnails Grid 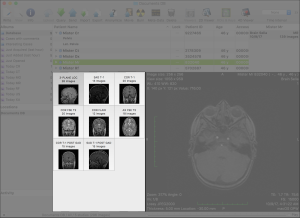
The Preview 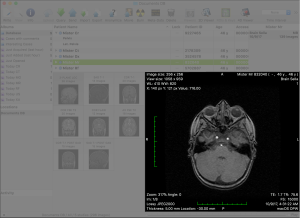
The Albums List
Albums are either user-defined filters (smart albums, displayed with a purple icon) or user-defined collections (plain albums, displayed with a blue icon).
The Locations List 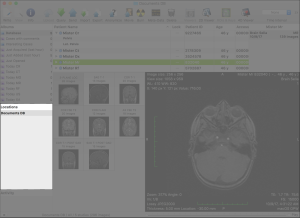
The Activity List